Before you start
The schema at a glance
What you see. A knowledge graph of one blended finance deal: the actors who fund it, the instruments they use, the KPIs it is measured against, and the risks, standards and documents attached to it.
How it works. When you ask a question, the system does not search for words in documents: it follows the links in this graph (who funded what, with which instrument, measured how) and builds its answer only from what it finds.
Why it matters. Every answer comes with its sources, a sample size and a faithfulness check, so you can see what it is based on, and what it cannot tell you.
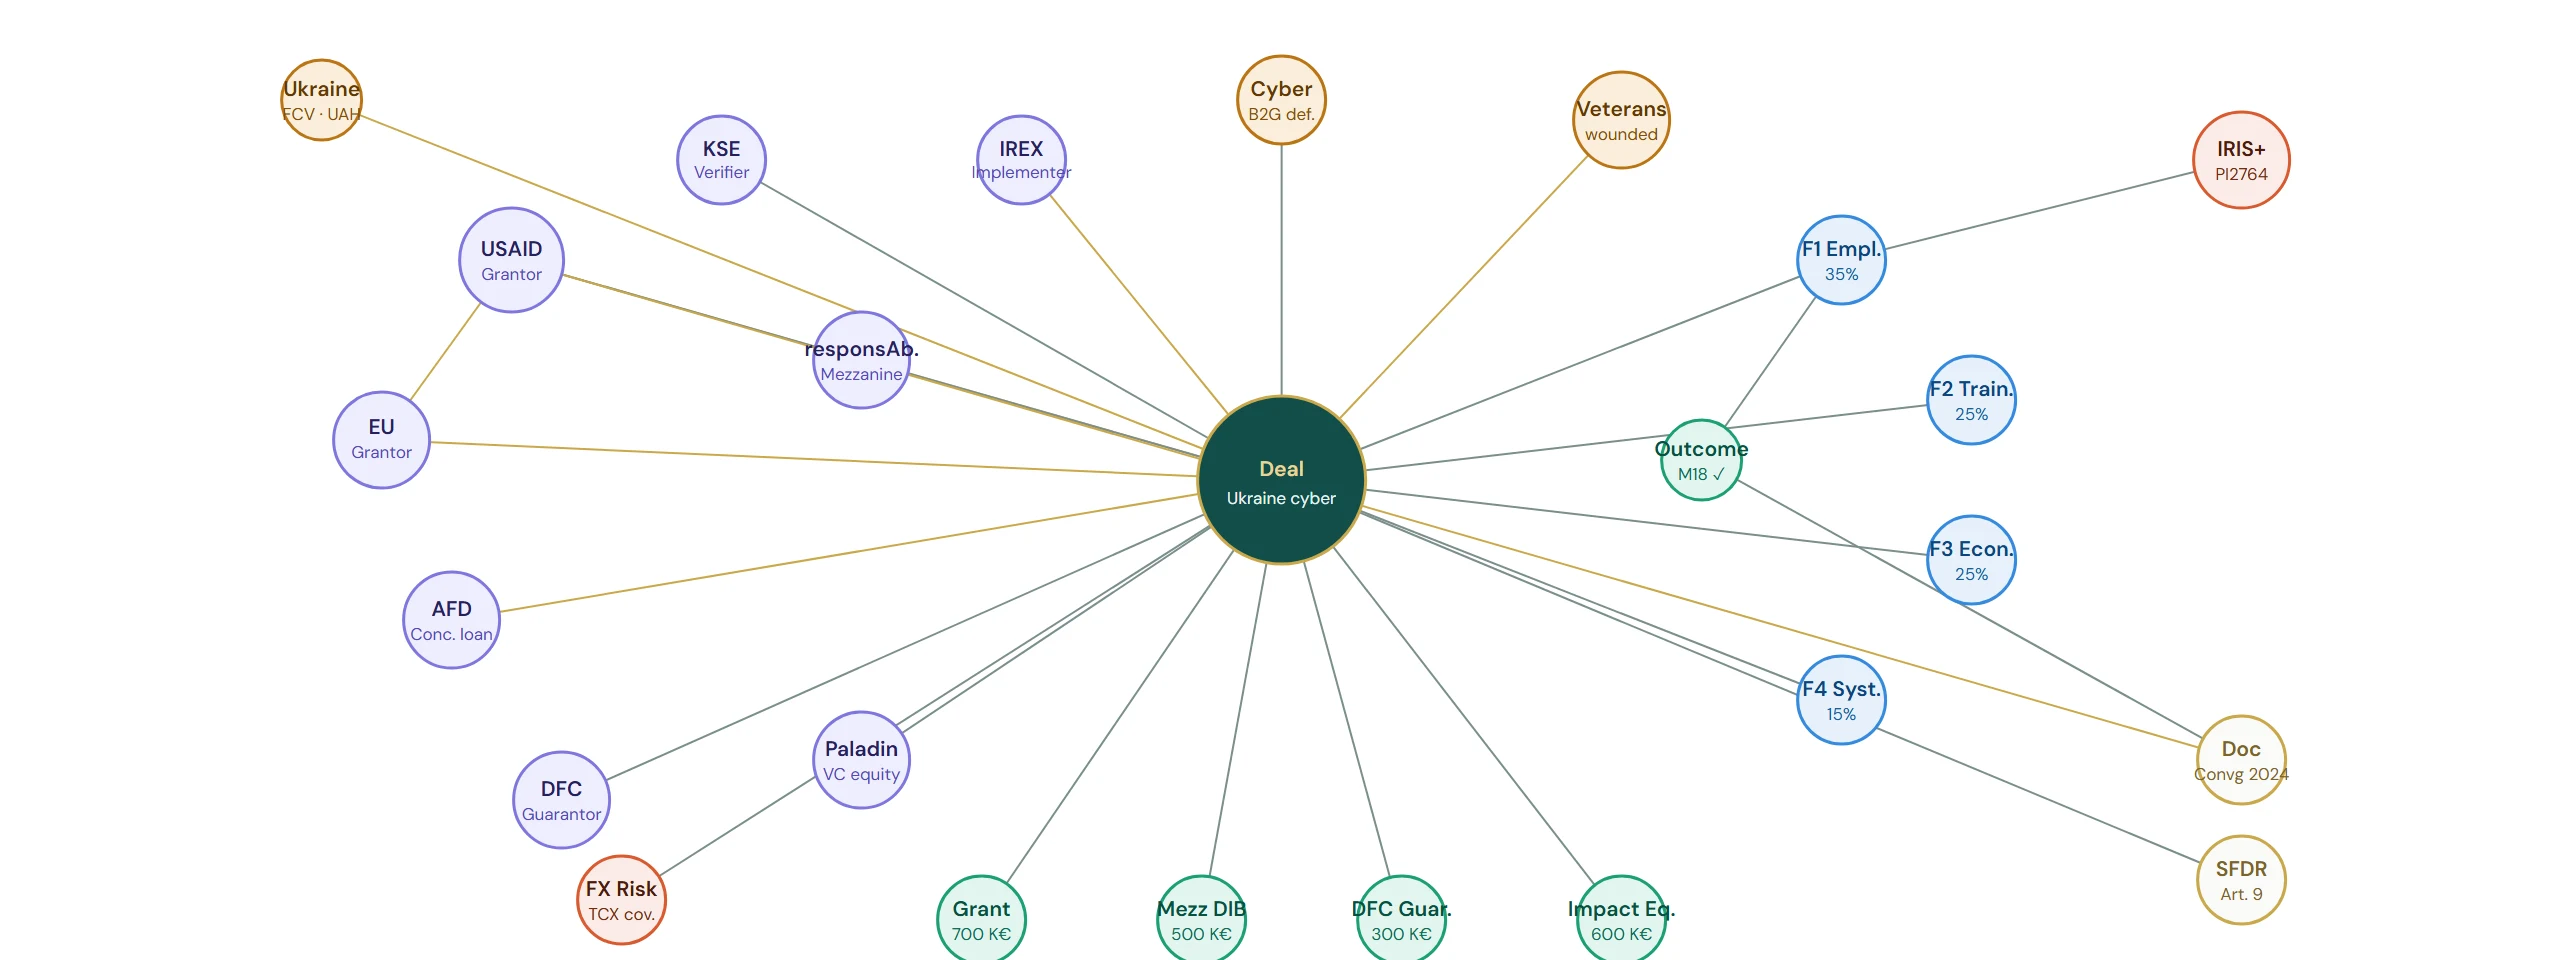
- The deal — the transaction being analysed
- Actors — funders, investors, verifiers, implementers
- Instruments — grant, mezzanine, guarantee, equity
- Impact KPIs — what the deal is measured against
- Context — country, sector, target population
- Risks & standards — FX risk, IRIS+ metrics
- Evidence & regulation — source documents, SFDR